Diagrams showing the historical development of inflation in Germany
The following charts show the historical price development in Germany.
The published values for the years 1948 to 1990, with 1995 as the base year, are converted to the
base year 2020.
The annual values for the current year 2026
are provisional values resulting from the average of the monthly values of the inflation rates already published.
Content
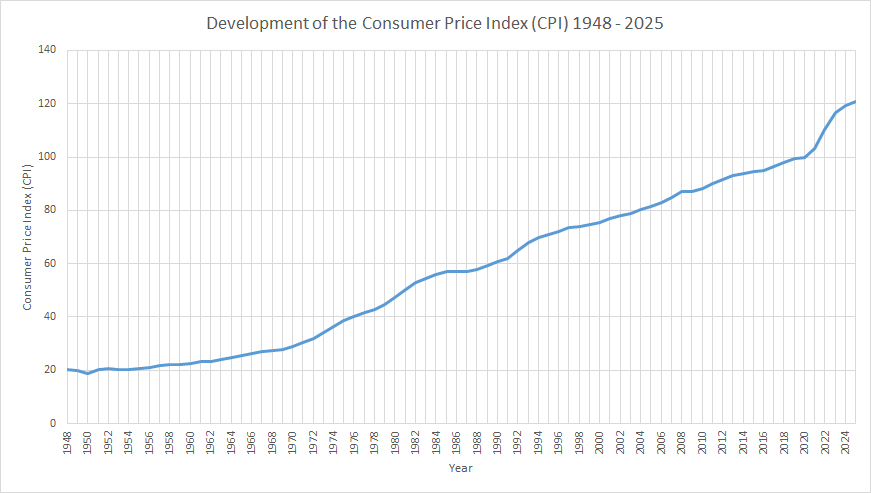
Development of the consumer price index (CPI)
The development of the consumer price index (CPI) in Germany begins in 1948 with a value of 20.2 in relation to the
base year 2020.
The course of the consumer price index is a reflection of the percentage
price increase over the years.
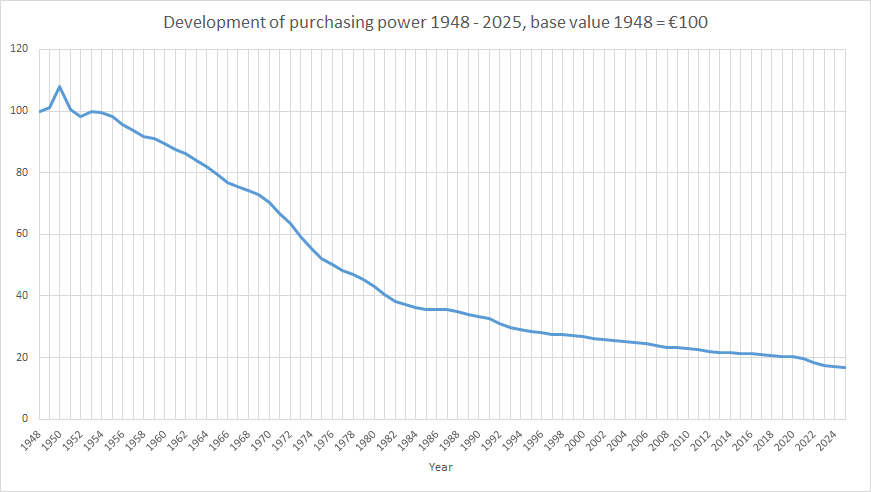
Development of purchasing power
The course of purchasing power is an illustration of the loss in value of money since 1948
with a converted base value of €100. The fluctuations in price development
and purchasing power are shown in more detail by the development of the inflation rate in the following diagram.
Development of inflation Rate
The inflation rate reflects the annual percentage increase in prices and is calculated from the
annual change in the consumer price index (CPI).
The fluctuations in price trends and purchasing power are illustrated in more detail by the development of the inflation rate in the following diagram:
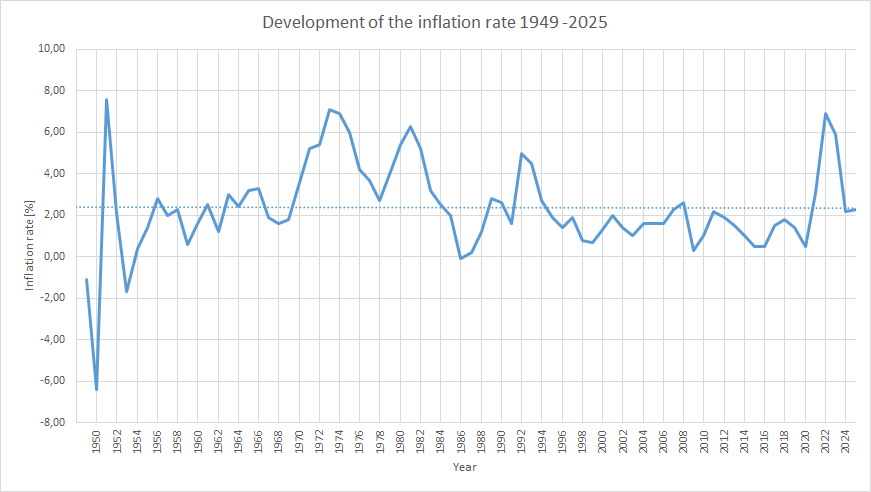
The lowest inflation rate (price increase) per year over the entire period consideration started with 1948 was in the year 1950, with a negative price increase of -6.4%
relative to the previous year. This means that Germany experienced a deflation, which had already begun in 1949 (-1.1%) and ended in 1950.
The maximum inflation rate was in the year 1951 with a price increase of 7.6%. Germany had other years with deflation relative
to the previous year in 1953 (-1.7%) and 1986 (-0.1%). High inflation rates of more than 6% relative to the previous year occurred in Germany
1973 (7.1%), 1974 (6.9%), 1981 (6.3%) and 2022 (6.9%).